01
UX Friction Audit
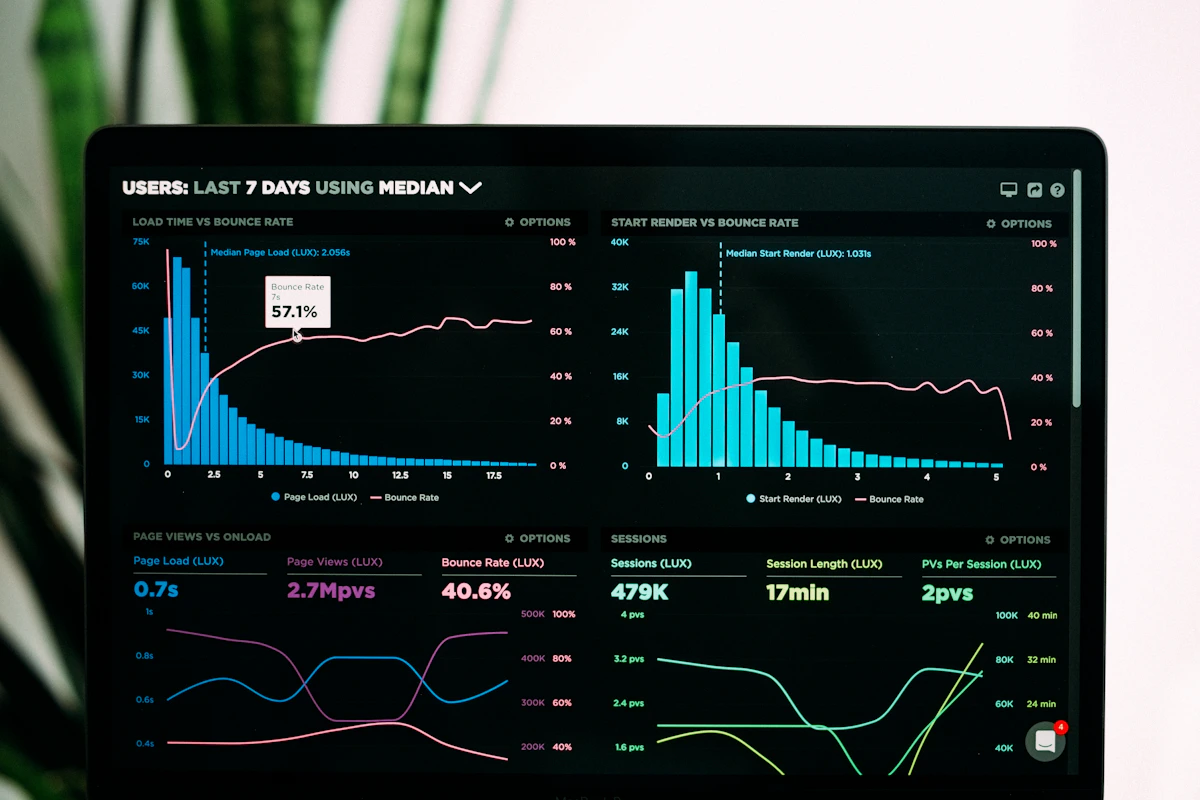
A focused review of behavioural data, user journeys and interface signals to locate avoidable drop-offs in your app.
Explore this engagement →UX friction analytics · Malaysia
We connect journey data, interaction signals and real session evidence to show where your app creates doubt, delay or dead ends—and what your team can improve next.
Built for product, design and digital teams that need evidence—not another dashboard.
Ways to work together
Whether the data is incomplete, the drop-off is unexplained or releases move too quickly to investigate, we shape the work around a real journey.
A focused review of behavioural data, user journeys and interface signals to locate avoidable drop-offs in your app.
Explore this engagement →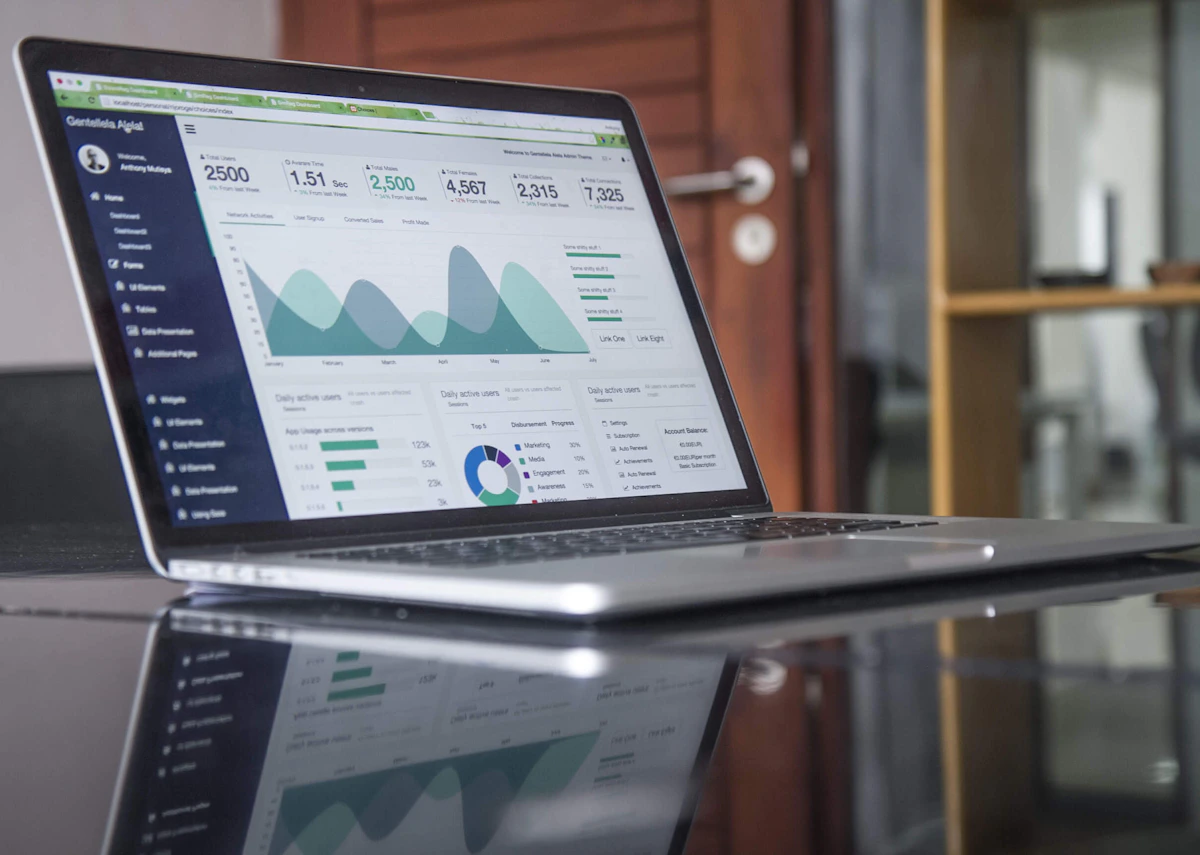
A clear event-tracking plan for the customer actions that matter, designed around your product decisions rather than vanity metrics.
Explore this engagement →
A recurring analytics review that catches emerging experience problems after launches, campaigns and product changes.
Explore this engagement →
From analytics query to product decision, without losing context.
A useful finding has a next step
We organise each issue around the affected journey, observed behaviour, supporting evidence and likely consequence. Your team sees what is known, what is inferred and what needs further research.
Locate the point of friction and the users affected.
Explain the behaviour with corroborating signals.
Prioritise changes by impact, confidence and effort.
“Good analytics does not replace conversations with users. It tells you which conversation is worth having next.”
Our principle for every engagement
Field notes
Start with one difficult journey
Share the flow, the signal and what your team has already tried.